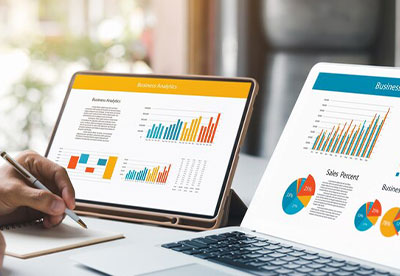
Today every business has a profusion of data, but it gets difficult for businesses to understand and interpret the complexity of data. That is where tools like augmented analysis show up!
Augmented analytics are the tools that help decision-makers analyze and understand data better by harnessing the power of artificial intelligence and machine learning and helping decision-makers get deeper data insights.
Businesses can get exceptional value from augmented analytics tools as it helps to get data insights quickly, with minimum IT expertise and knowledge when it comes to working with data. In a nutshell, augmented analytics offers enormous data benefits and further helps in data exploration which is a necessary step in Business Intelligence.
Data exploration is the first step in data analysis that involves the use of data visualization tools and techniques to unleash the power of data and extract meaningful insights. Augmented Analytics enhances the process of data exploration in BI by integrating advanced technologies such as machine learning, natural language processing (NLP), and automation.
Here are several ways by which augmented analytics helps in Data Exploration in BI-
Discovers data patterns and trends
When the volume and complexity of data increases, it becomes difficult to find the trends and patterns with traditional business intelligence tools, and based on that users draw data conclusions from their past experiences which can lead to poor decisions. However, augmented analytics through its machine learning algorithms helps to detect patterns in data automatically. It reduces the manual efforts required for exploration.
Better data insights by using Natural language processing
NPL allows users to interact with the system through text and voice to resolve their queries by optimizing the linguistic capabilities of technology. This allows users to explore data without having enough IT knowledge. This also results in effective collaboration by facilitating communication about data insights using natural language. This is particularly helpful for disciplinary teams where not everyone is proficient in data analysis.
Easy deviation detection
By applying anomaly detection algorithms, it becomes easy to detect any deviation or irregularity in data. This is valuable in detecting unusual patterns in data that need further investigation. Deviation can give ideas to decision-makers that can prove to be a threat or an opportunity.
Helps in Advanced and Predictive Analytics
The integration of predictive analytics allows decision-makers to forecast future trends and outcomes based on historical data. This forward-looking capability enhances data exploration and analysis by providing insights into potential future cases. Augmented analytics make future analysis more accessible, interpretable, and actionable for a wide range of users within an organization and help them to better leverage business insights
Assists in data preparation
Augmented analytics tools optimize data preparation tasks through data cleansing and transformation and make data suitable for data analysis. This streamlines the exploration process by ensuring that data is ready for analysis and additionally saves the time and cost involved in fundamental tasks for data cleaning.
Final Words
Augmented analytics would be the next big thing for Business Intelligence. The advantages offered by augmented analysis have led to a shift to the self-service analysis of data, where business users can interact and interpret the data without the data analyzing expertise or any specialized team. Thus, these analytics can efficiently handle vast amounts of data.
We at Canopus Infosystems understand the transformative role data plays for any business. With our professional expertise, we can help you unlock the power of Business Intelligence tools.
2 mins read


