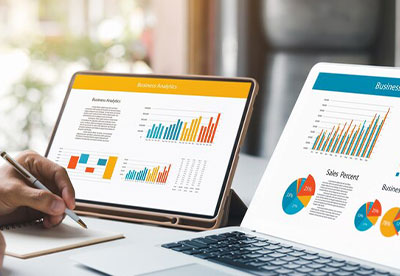
In the data-driven world, today businesses depend heavily on data insights to make informed decisions. But do you ever wonder how companies achieve this?
The answer lies in optimizing dashboards!
Dashboards are considered the finest and most powerful way to present valuable findings through the application of data visualization techniques. Dashboards facilitate a centralized view of data, making it easier to find trends and patterns and saving a lot of time in analysis.
But what other reasons contribute to incorporating dashboards nowadays, let’s check-
- Get access to significant metrics in a fraction of the time with a comprehensive view of data.
- Depicts complex data in a visual format, making it convenient to remember as well as draw insights from
- Minimizes time spent in creating reports and further eases the process of analyzing the reports better
- Can access dashboards from anywhere and anytime, streamlining business processes and boosting decision-making processes.
These are some of the many reasons that businesses look after while adopting dashboards for their business. But to get more actionable insights and truly harness the power of data, customizing dashboards is something that would take the insight game a step further and meet the specific needs of users.
Let’s dive into the key aspects of designing a customized dashboard-
Keeping User-Centric Approach
Understanding user requirements is the basic approach to consider while embracing the business’s customization journey. In the same organization, there can be diverse needs of different stakeholders and to meet those requirements it requires high-level dashboard customization. For instance, high-level authorities may want to access high-level KPIs and trends while analysts may require different kinds of analytics. All this can be better done through better user research to meet the unique requirements.
Opting Right Data Visualization Techniques
After understanding the needs of businesses, it becomes necessary to opt for appropriate data visualization techniques that can represent the data effectively with clear visuals. It involves opting for the right type of chart widgets and graphs that can enhance the required type of data. For instance, line graphs are used to depict trends over time, and pie charts to illustrate the percentage distribution. Thus, by better understanding the different custom dash ideas, information can be presented in a way that resonates with the data type and user’s requirements.
Customized Layouts
For optimum user experience, it is important to tailor the layout structure and design of the dashboard. This involves logically arranging paramount information and minimizing the complexity of data. Instead of making the dashboard fancy and adding dozens of color charts, it is always better to convey the findings with the best-chosen charts and graphs without overdoing them. Thus, by adding a clean yet visually appealing design and layout, dashboard designers can maximize usability. Moreover, adding color schemes that match with brand voice can reinforce brand recognition.
Incorporating Interactive Features
An interactive dashboard is a data management tool and adding interactive functionalities can enhance user experience. With the help of features such as drill down, advanced dashboard filters can help users explore the data in-depth and make a well-informed decision. Organizations can easily communicate significant business numbers by incorporating interactive features within and outside the organization. Additionally, dashboards can be restricted from employees to have limited access and can see what is appropriate as per their roles.
Summing Up
Dashboards, being part of the Business Intelligence realm, not only address the data analytics problem but allow departments to collaborate and communicate better. Further, offering customized options can help enhance the user experience by allowing them to choose their preferred visualization styles and set relevant parameters to tailor the dashboard to their specific needs.
At Canopus Infosystems, we can address all your data analytics problems with our customized dashboard solutions that align well with your business goals and needs.
Drive your business with Real-time interactive dashboards!
3 mins read


