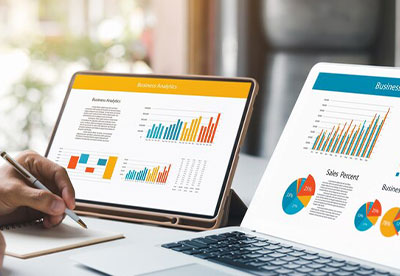
Do you remember how promptly we used to remember every detail that was shown through projectors or visuals in schools as compared to learning the same thing from books?
What was the logic behind this fun-loving and effective way of understanding data better?
Visuals are always a compelling way and act as a powerful tool to remember things and draw better outcomes from them. Additionally, it creates a long-lasting impression on our minds.
The same applies to data visualization, which plays a vital role in helping business people analyze the data better with the implication of appealing visuals in the form of different types of graphs and charts. Today, data visualization is not just restricted to the application of different forms of graphs but has paved and transformed the way companies analyze vast data sets.
If you want to reach your customers quickly by creating everlasting impact, then integrating data visualization BI tools can be the ultimate solution and a game changer for your industry!
Let’s expose what are these top 5 Data Visualization Trends-
Data Accessibility by Ways of Data Democratization
Earlier data was only accessed by data scientists and was restricted to only data engineers. But with the growing profile dynamics of the data scientists, and to ease down their work, data is democratized now. This implies that every person in the organization can access the data, without the intervention of the IT department. It is made possible with the integration of no-code data analysis solutions.
As a result, obtaining data insights is now at our fingertips. It ensures that data is accessed by vast numbers of people who have the authority to create and analyze data visuals on their own.
Real-time Data Visualization and Interpretation
In today’s fast-paced world, it is important for businesses to quickly respond to changing customers’ needs, and any delays in response can lead to losing customers. In such a scenario, real-time data visualization can boost the decision-making process by interpreting huge amounts of the data in your chosen visuals.
It allows businesses to gain a competitive advantage by seizing opportunities quickly by identifying trends and patterns in customer data.
Animation and Video Visualization
Visuals and animation can build a closer connection with the customers due to its power to create an ever-lasting impact with appealing visuals. For instance, today we can witness that people find YouTube a better platform to grant knowledgeable content, and data visualization plays a significant role in enhancing the learning experience. Visual representations of data or video infographics can clarify complex topics and help learners grasp information more effectively.
Another way of reaching customers is data storytelling, which involves creating compelling narratives from data to communicate insights better.
Businesses can utilize these platforms by harnessing the power of data visualization, to share complex data.
Integrating AI With Data Visualization
Artificial Intelligence plays a prominent role in enhancing visualization, by automating tasks and unleashing insights better. One of the many benefits of AI is the adaptive visualizations in response to data changes. It implies that visual adjustments can be made in real time by adjusting the input data. Further, it ensures that the data source is accurate and visualization sources are authentic. This is important as wrong sources can mislead conclusions and lead to wrong decisions.
It allows businesses to automate several tasks and provide a more interactive and responsive experience.
Presenting Visualization With Mobile
Due to the increasing usage of mobile phones, companies must consider modifying their data visualization approach to be mobile-compatible. Responsive designs will increase the user base by offering a better user experience.
Businesses can improve their connections with customers by unleashing their business potential through mobile.
Final Words
Effective data visualization is not merely about presenting data through graphs, it’s about depicting complex information in the best ways possible. Above mentioned are the trendsetting data visualization approaches that can boost your business outreach. Businesses can enlarge their customer base by adopting their trends.
We at Canopus InfoSystems have expertise in offering dashboard and analytics solutions, by better implementing these trends to stay competitive.
3 mins read


