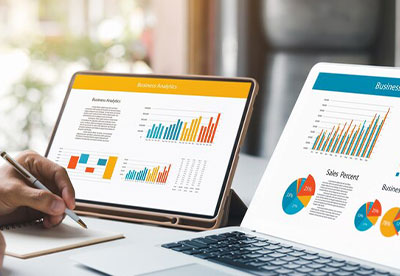
Our brain understands visuals better as they are easy to remember and make sense of data easier and quickly. In a time when employees are already overloaded with information, data visualization is a tool that helps them to understand information easily and quickly.
If you had performed each step of data analysis very well such as data collection, data cleaning, and data analysis, but in the end were not able to present in the desirable and understanding manner to the decision makers, then your whole efforts can go to waste.
After doing data analytics, if data can’t be presented due to the wrong choice of data visualization tool to depict the key data findings, it would not only lead to a delay in decision-making but can also mislead your audience. Choosing the right data visualization tools can truly make or break your decisions, so there should be some common things to keep in mind before selecting a data visualization tool. When choosing a data visualization tool, businesses can focus on the questions below to find the best fit.
How large are your datasets?
The size of datasets can help you choose the correct data visualization tool. Having small datasets leads to choosing general-purpose tools while complex and large datasets demand specialized visualization tools as it requires data storage and retrieval mechanisms. For large datasets, scalability becomes an issue, so ensure the tools selected can grow as your data grows.
What type of chart will best depict your business goals?
Some tools have better options for charts that align well with your business goals. It becomes necessary first to consider the nature of your data and its types such as geographical data, numerical data, time series data, or any other kind, and then opt for a tool that supports your data types. For instance, some of the businesses require interactive charts. In such cases, the selected tools should have features like zooming, filtering, and drill-down capabilities.
Do you want to view your data in a single place?
Many companies want to depict multiple datasets in one place, just to make an easy understanding of data and reduce complexity. Knowing this in advance allows us to choose a data visualization tool that helps us visualize the data on the same dashboard. Centralized data demands a tool that can collect data from multiple sources and in multiple formats. Also, the selected tool should support APIs for different data storage systems, cloud services, and data streaming platforms.
Which tool integrates well with your team’s expertise?
It can be a circumstance that the chosen visualization tool doesn’t get well integrated with your team’s expertise and can affect efficiency and productivity. Thus, the tool selected should match well with the team’s expertise and then they are more likely to utilize its advanced features effectively. At most, members can at least adapt to the tool easily.
Do you want to grant access to customers to download data from reports?
Viewers sometimes need access to export the data such as downloading Excel sheets or some other insight images. In this circumstance, data privacy becomes crucial, and the selected tool must offer robust security features and user authentication. In addition to data security checks, ensure customizing the data export options as some customers may have specific data requirements that they want to download.
Wrapping Up
These questions will definitely help you in advance to choose apt data visualization tools that align well with your data. A data visualization tool is good enough when the audience can remember the findings well and can simply draw conclusions from them. To choose the right data visualization tool, make sure you understand your data well as it would serve as a base.
We at Canopus Infosystems understand that selecting the right data visualization tool can accelerate the decision-making process and hold enough power to make data insightful without Business Intelligence Services. The data visualization tools we use to visualize data better are Tableau, Power BI, and Datorama. Any of these tools can be used once data matures. We are here to help you choose tools that maximize data clarity.
3 mins read


