The present century is called the digitized 21st century and every sector technologically depends on another one. The agriculture sector too has seen many advancements since the digital age has arrived.
Changing the scenario of the agricultural sector through real-time insights and visually striking data presentations has been a boon to the industry. Today this industry stands at an exponent amount of trillion dollars, and it is still in its initial phase.
Modern technology has changed the game, and its main player is data and how data is being used. The Agrarian industry has been transforming rapidly, seeing changes in data presentations through digitalization and data technologies that aim to improve productivity, and decision-making, and increase efficiency.
The world needs a sustainable agrifood system that is data-driven, insightful, collaborative, and profitable and all these key insights are possible through data visualization.
Wondering how?
Let’s dive into agricultural insights of data visualization-
Determines Weather Patterns and Climate Trends
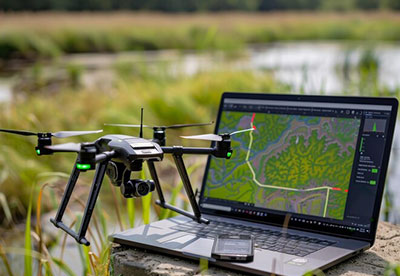
Agriculture has always been at the mercy of climate and is specified by how climatic patterns determine the area through real-time monitoring. Through data transformation and visualization, the real-time weather data gets converted into farm management systems. It ensures the possibilities of what is coming next and predicts the future by using advanced sensors that update minute-to-minute information on temperature, humidity, precipitation, and wind patterns.
Boosts Decision-making With Compelling Visual Data Presentations
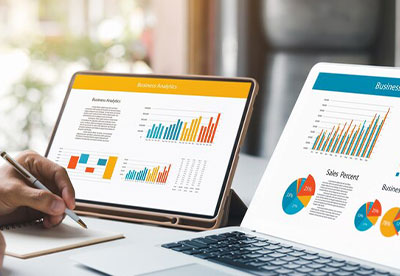
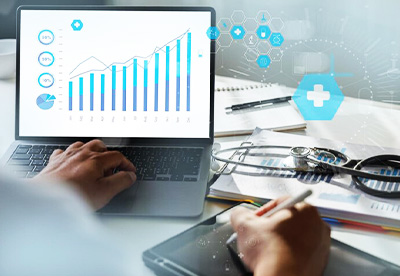
Visual data presentations have proved to be a game changer in transforming multiplex data into easy, actionable, and optically appealing formats. Visual data presentations specify interactive dashboards and computer-generated storytelling data that enhance the farmer’s understanding more interestingly. This also helps researchers and stakeholders to predict and make more informed decisions.
Safeguarding Crops Through Technology
Diseases and pest control is one of the most important functions of the agarin industry. Integrating data visualization helps in the real-time monitoring of crops through its sensory networks and IoT devices. No one can control external factors that depict the agricultural future but AI-powered image recognition, data integration for holistic insights and decision support systems have been proven effective in controlling the damage or potential damage that might happen.
Effective Supply Chain Monitoring
For the seamless flow of products in the agricultural sector, supply chain management and monitoring should be transparent and effective. The process starts from harvesting the crop and ends with the end consumer buying it, this whole lot involves a supply chain that proves to be useful with the integration of data analytics for demand forecasting. For tracking crop production, sensor technology is used, and quality is controlled through data.
Maintains Smart Data Analytics
The power harnessed by machine learning for crop monitoring, artificial intelligence, automated decision support, soil health monitoring, and continuous improvement through feedback loops to draw out meaningful and specific insights transform smart data analytics. Sources like these help farmers and researchers to allocate and optimize resources, make informed decisions, and revolutionize overall productivity.
Final Words
The agrarian industry is one of the most important sectors in the world, and with the advancement of new technologies paving its way, it will soon have a larger impact on how producers are viewed. The proper supply chain and real-time monitoring integrate effectiveness and transparency which helps farmers in all forms.
We at Canopus Infosystems, combine services like Business Intelligence, which will help you visualize data sets and presentations that will scale your business to the next level.
2 mins read


