The amount of data generated by businesses is huge and growing exponentially. As per Dell Technologies, Companies will need to implement several technologies like 5G, cloud computing, and machine learning to manage their data in the future. All data generated by organizations is useless if it can’t be managed and interpreted to be used in a productive manner.
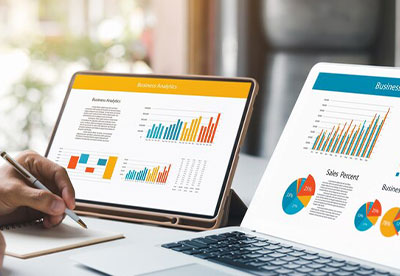
The need to implement visualizations is the best way to interpret and make data decision-worthy. Data visualization can help in interpreting complex and large data by converting it into infographics, charts, and graphs and facilitate making data easy to understand.
Let us deep dive into how data visualization can provide deeper data insights and help you create wondrous business strategies
Helps in Identifying Trends and Patterns in Data
By implementing data visualizations, it becomes easy to identify patterns and trends in data that might not be understandable when looking at raw data. It offers companies an opportunity to unveil valuable insights and make data-driven decisions. Furthermore, data visualizations make it easy to identify anomalies in your data, which may require special attention on a priority basis. These shortcomings may lead to unseen opportunities or threats.
Helps in Making Comparative Analysis Easier
Data analysis with the help of a graphical representation through charts and graphs allows companies for easy comparisons between different data points, variables, or categories. Visualizations can highlight variations in the data through color coding, adding annotations, or visual elements. It allows companies to identify which data points stand out.
Helps in Assessing Potential Risks
Companies at times get exposed to several risks at once. Visualizing these risks in a portfolio manner enables a thorough knowledge of all potential threats and their interdependencies. By clearly presenting information on potential threats and weaknesses, data visualizations aid in risk assessment. It makes it possible for companies to create risk mitigation plans that safeguard their interest.
Facilitates Effective Communication by Conveying Complex Information
Visualizations are an excellent medium to communicate complex information to stakeholders. The reason is that visualizing data, facts, and processes through charts and diagrams is a helpful approach as it allows everyone to have a shared understanding.
When visualizations are understandable, communicating strategies become clear as complex data can be presented in an organized and structured way.
Helps in Tracking the Progress of the Plans
Visualizations are useful in monitoring how your strategies are doing over time. You can design dashboards that visibly display key performance indicators (KPIs), allowing you to determine whether your plan is working as intended or needs modification.
Final Words
If you are dealing with complexities in drawing better insights or conclusions from your raw data, then data visualization can help in communicating complex data in a clear and ever-engaging way. We at Canopus Infosystems understand the importance of data and the need to draw meaningful conclusions from it. Our services can help you identify trends and patterns from data and help discover new opportunities and threats.
Utilize the power of your data to propel the growth of your business. Canopus Infosystems helps you select, suggest, and establish the ideal framework to unlock the full potential of your data.
2 mins read


